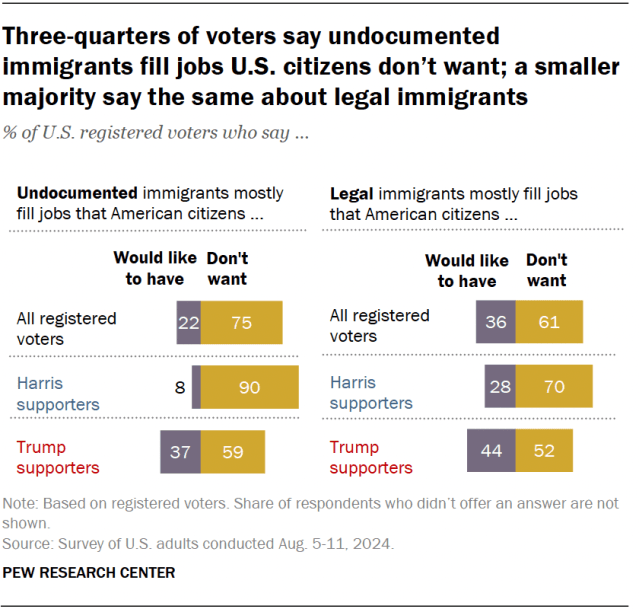
Majorities of U.S. registered voters say immigrants – both undocumented and legal – mostly fill jobs American citizens don’t want, as opposed to jobs citizens would like to have.

Three-quarters of voters say undocumented immigrants fill jobs citizens don’t want, while a lower share (61%) say the same of legal immigrants, according to a Pew Research Center survey conducted in August 2024.
The impact of immigration on the U.S. job market has come up regularly in the 2024 presidential election. Supporters of Democratic presidential candidate Kamala Harris and her Republican opponent Donald Trump have points of agreement and disagreement on this issue.
Notably, majorities of Harris and Trump supporters say that undocumented immigrants mostly fill jobs that Americans don’t want. Even so, substantial differences exist: 90% of Harris supporters hold this view, compared with 59% of Trump supporters.
Large shares in both coalitions also say legal immigrants mostly take jobs that U.S. citizens don’t want. Seven in ten Harris supporters say this, compared with around half of Trump supporters (52%).
Overall, views have changed little since May 2020, the last time we asked these questions. At that time, 77% of U.S. adults said undocumented immigrants mostly fill jobs that U.S. citizens don’t want, while 64% said the same about legal immigrants. Partisan differences in views have also not changed much since 2020.
Views by race and ethnicity
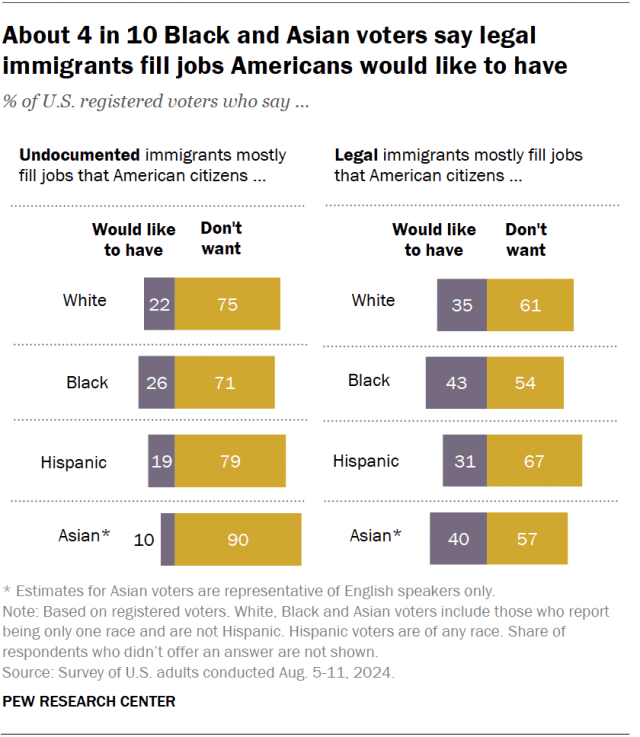
Voters differ somewhat by race and ethnicity over whether undocumented and legal immigrants take jobs that U.S. citizens don’t want.

Nine in ten Asian voters say undocumented immigrants mostly fill jobs that American citizens don’t want, as do large majorities of Hispanic (79%), White (75%) and Black (71%) voters.
- Among Harris supporters, majorities across racial and ethnic groups say undocumented immigrants mostly take jobs that citizens don’t want.
- Black Harris supporters are less likely to hold this view. Three-quarters of Black voters who support Harris (75%) say undocumented immigrants mostly fill these jobs, compared with larger shares of Hispanic (93%), White (94%) and Asian (96%) Harris supporters.
There are insufficient sample sizes to show results by race and ethnicity among Trump supporters in this analysis.
When it comes to legal immigrants, 67% of Hispanic voters overall say these immigrants mostly fill jobs that American citizens don’t want, as do smaller shares of White (61%), Asian (57%) and Black (54%) voters.
- Harris supporters again differ somewhat by race and ethnicity. Black and Asian voters who support Harris (56% and 58%) are less likely than White and Hispanic Harris supporters (73% and 77%) to say legal immigrants mostly fill jobs that citizens don’t want.
How many immigrants are in the U.S. labor force?
Over 30 million immigrants were in the U.S. workforce as of 2022, accounting for 18% of all U.S. workers.
- Lawful immigrants made up the majority of the immigrant workforce at 22.2 million, representing about 13% of all workers.
- An additional 8.3 million immigrant workers were unauthorized (about 5% of all workers). This is a notable increase over 2019 but about the same number as in 2007.
What kinds of jobs do immigrants in the U.S. hold?
By Industry
When looking at industries – the kind of business that employers do – immigrants accounted for about a quarter of workers (27%) in the agriculture, forestry, fishing, and hunting sectors in 2022. This was followed by construction (26%), according to a Center analysis of U.S. Census Bureau data. There are no major U.S. industries in which immigrants outnumber those born in the country.
The largest shares of unauthorized immigrant workers were in the construction (13%), agriculture, forestry, fishing and hunting (12%), and leisure and hospitality (7%) industries in 2022. Legal immigrant workers accounted for the largest shares in the transportation and utilities (15%) and other services sectors (15%), followed by professional and business services (14%) and agriculture, forestry, fishing, and hunting sectors (14%) – only slightly above their share of the overall workforce.
By occupation
When looking at occupations – the kind of work that people do on the job – immigrants overall accounted for the largest share of workers in farming, fishing, and forestry (43%) in 2022, followed by construction and extraction (29%). Immigrants outnumbered U.S.-born workers in some jobs, such as manicurists/pedicurists (73%), taxi drivers (57%), and drywall/ceiling installers (53%).
Unauthorized immigrant workers accounted for the largest shares in occupations such as drywall/ceiling tile installers and tapers (33%), roofers (32%), painters and paperhangers (28%), other agricultural workers (24%), construction laborers (24%), and maids and housekeeping cleaners (24%). Legal immigrant workers accounted for the largest shares in jobs such as manicurists/pedicurists (60%), taxi drivers (44%), interpreters and translators (38%), other life scientists (35%), and physical scientists (34%).

